Improving Burst Inspector search performance


My name is Jonas Reholt and I’m a student working with the Burst team. I’m taking to the blog to share my journey of optimization that helped make recent performance changes to the Burst Inspector possible. Burst Inspector search is now 13 times faster, enabling developers to more quickly focus on the code they care about when optimizing projects.
Continue reading to learn how you can use the Unity Profiler to investigate performance bottlenecks in your program and how to fix them.
Intro to the Burst Inspector
The Unity Burst compiler transforms your C# code into highly optimized assembly code. The Burst Inspector lets you inspect that assembly code directly in the Unity Editor, so you don’t need to use external tools for simple code inspection.
When first opening the Burst Inspector and selecting a target job to display, you’ll see a window similar to the image below.


As you can see, the Burst Inspector provides syntax highlighting, branch flow arrows, and much more.
The inspector will try to scroll to the assembly that’s implementing the chosen target function, but it’s also useful to search the assembly view for specific instructions, comments, etc. That brings us to the topic of this blog post.
Improving the performance of text search
To perform the search, the inspector has to search the original assembly output and transform these indices into positions in the inspector view. The original search functionality followed the pattern shown below, and relied heavily on the implementation of System.String.IndexOf(*).
while (assemblyCode.IndexOf(key, accIdx) >= 0) {
// ...
// Do logic for handling search hits
// ...
}
Running the above search on 135,582 lines of assembly code for a common search hit (21,769 hits in total) resulted in an execution time of about 12 seconds for the first search, and about 5 seconds for subsequent searches. This isn’t really a desirable waiting time for a GUI event, so we had to do something. Running the search through the Unity Profiler revealed that 37.3% of the execution time was spent in IndexOf(*), as seen below.

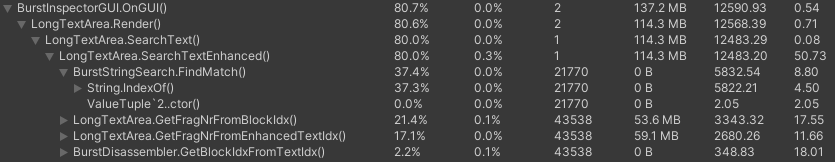
A sensible optimization has to address the reliance on this function, either by making a custom implementation or changing the algorithm altogether. No matter what algorithm is used, it will involve stepping through the entire string. So, some custom implementation for finding matches is required. Given this, it seemed fitting to start the optimization by keeping the original algorithm, but creating a custom IndexOf function.
The 3.34 seconds spent on LongTextArea.GetFragNrFromBlockIdx() stems from retrieving uncolored assembly code. This is used to perform the search. The Burst Inspector currently saves the assembly code twice – once formatted for rendering, and once unformatted.
Writing a custom function also has the nice side effect of reducing the number of calls, since there’s currently a call for each search hit, plus one.
The source code of IndexOf(*) reveals many safety checks needed for a robust general implementation. However, in our case we can safely assume most of these checks are true. To try and squeeze out every drop of performance, you’ll want to create a C-like function to avoid things like bounds check.
You can write the function following the pseudo code below, where IsKeyMatch(*) simply checks whether the key is a match or not.
List<int> Search(string assemblyCode, string key, int accIdx) {
     var hits = new List<int>();
     for (i = accIdx; i < assemblyCode.len - key.len; i++) {
	     if (IsKeyMatch(assemblyCode, key, i)) {
		     hits.add(i);
	     	     i += key.len-1;
          }
     }
     return hits;
}
However, because C# is a managed language, this C-like function requires you to pin the managed objects used so that the garbage collector does not relocate the memory address. Here is the boilerplate code:
unsafe {
	fixed (char* source = assemblyCode) {
		fixed (char* needle = key) {
			CustomIndexOf(source, key)
		}
	}
}
Putting these things together enables you to separate the original while loop into a single call to the indices finder and the logic for handling the search hits:
matches = FindAllMathces(text, key)
foreach match {
	...
	Do logic for handling search hits
	...
}
What were the gains? Using the small example from before, this change to the code gives a 6.6x speedup on the initial call, and a 13.2x speedup on subsequent calls (measured as old/new). The lower speedup on the initial search stems from the overhead of loading in the unformatted assembly to avoid finding matches in color strings.

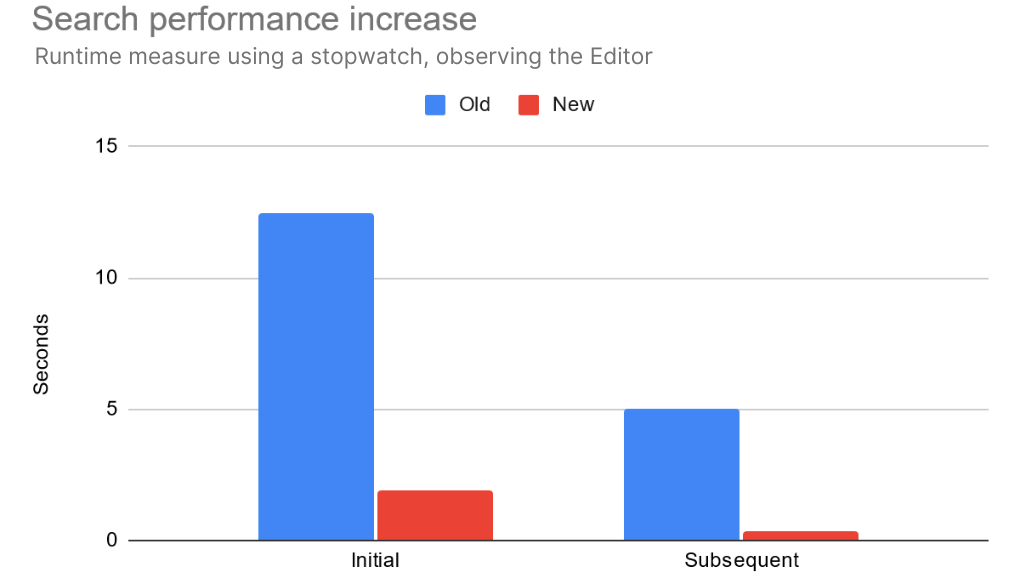
With these improvements, heavy-load searches with a little under 22,000 hits will now take about 1.8 seconds for the initial search, and around 0.4 seconds for subsequent searches. This makes the Burst Inspector more usable for large assemblies, since there’s no longer enough time to make a cup of tea during each search.
You can take advantage of this performance improvement now with the Burst 1.8.7 package.
Looking for more on Burst? Connect with us in the Burst forum. Be sure to watch for more new technical blogs from other Unity developers as part of the ongoing Tech from the Trenches series.
Is this article helpful for you?
Thank you for your feedback!
- Unity Labs
- Copyright © 2024 Unity Technologies