Debugging memory corruption: Who wrote ‘2’ into my stack?!


Hi, my name is Tautvydas and I’m a software developer at Unity working in the Windows team. I’d like to share a story of debugging an elusive memory corruption bug.
Several weeks ago we received a bug report from a customer that said their game was crashing when using IL2CPP scripting backend. QA verified the bug and assigned it to me for fixing. The project was quite big (although far from the largest ones); it took 40 minutes to build on my machine. The instructions on the bug report said: “Play the game for 5-10 minutes until it crashes”. Sure enough, after following instructions, I observed a crash. I fired up WinDbg ready to nail it down. Unfortunately, the stack trace was bogus:
# Child-SP RetAddr Call Site
00 00000022`e25feb10 00000000`00000010 0x00007ffa`00000102
0:050> u 0x00007ffa`00000102 L10
00007ffa`00000102 ?? ???
^ Memory access error in 'u 0x00007ffa`00000102 l10'
Clearly, it tried executing an invalid memory address. Although the stacktrace had been corrupted, I was hoping that only a part of the whole stack got corrupted and that I should be able to reconstruct it if I look at memory contents past the stack pointer register. Surely enough, that gave me an idea where to look next:
...............
00000022`e25febd8 00007ffa`b1fdc65c ucrtbased!heap_alloc_dbg+0x1c [d:\th\minkernel\crts\ucrt\src\appcrt\heap\debug_heap.cpp @ 447]
00000022`e25febe0 00000000`00000004
00000022`e25febe8 00000022`00000001
00000022`e25febf0 00000022`00000000
00000022`e25febf8 00000000`00000000
00000022`e25fec00 00000022`e25fec30
00000022`e25fec08 00007ffa`99b3d3ab UnityPlayer!std::_Vector_alloc<std::_Vec_base_types<il2cpp::os::PollRequest,std::allocator<il2cpp::os::PollRequest> > >::_Get_data+0x2b [ c:\program files (x86)\microsoft visual studio 14.0\vc\include\vector @ 642]
00000022`e25fec10 00000022`e25ff458
00000022`e25fec18 cccccccc`cccccccc
00000022`e25fec20 cccccccc`cccccccc
00000022`e25fec28 00007ffa`b1fdf54c ucrtbased!_calloc_dbg+0x6c [d:\th\minkernel\crts\ucrt\src\appcrt\heap\debug_heap.cpp @ 511]
00000022`e25fec30 00000000`00000010
00000022`e25fec38 00007ffa`00000001
...............
00000022`e25fec58 00000000`00000010
00000022`e25fec60 00000022`e25feca0
00000022`e25fec68 00007ffa`b1fdb69e ucrtbased!calloc+0x2e [d:\th\minkernel\crts\ucrt\src\appcrt\heap\calloc.cpp @ 25]
00000022`e25fec70 00000000`00000001
00000022`e25fec78 00000000`00000010
00000022`e25fec80 cccccccc`00000001
00000022`e25fec88 00000000`00000000
00000022`e25fec90 00000022`00000000
00000022`e25fec98 cccccccc`cccccccc
00000022`e25feca0 00000022`e25ff3f0
00000022`e25feca8 00007ffa`99b3b646 UnityPlayer!il2cpp::os::SocketImpl::Poll+0x66 [ c:\users\tautvydas\builds\bin2\il2cppoutputproject\il2cpp\libil2cpp\os\win32\socketimpl.cpp @ 1429]
00000022`e25fecb0 00000000`00000001
00000022`e25fecb8 00000000`00000010
...............
00000022`e25ff3f0 00000022`e25ff420
00000022`e25ff3f8 00007ffa`99c1caf4 UnityPlayer!il2cpp::os::Socket::Poll+0x44 [ c:\users\tautvydas\builds\bin2\il2cppoutputproject\il2cpp\libil2cpp\os\socket.cpp @ 324]
00000022`e25ff400 00000022`e25ff458
00000022`e25ff408 cccccccc`ffffffff
00000022`e25ff410 00000022`e25ff5b4
00000022`e25ff418 00000022`e25ff594
00000022`e25ff420 00000022`e25ff7e0
00000022`e25ff428 00007ffa`99b585f8 UnityPlayer!il2cpp::vm::SocketPollingThread::RunLoop+0x268 [ c:\users\tautvydas\builds\bin2\il2cppoutputproject\il2cpp\libil2cpp\vm\threadpool.cpp @ 452]
00000022`e25ff430 00000022`e25ff458
00000022`e25ff438 00000000`ffffffff
...............
00000022`e25ff7d8 00000022`e25ff6b8
00000022`e25ff7e0 00000022`e25ff870
00000022`e25ff7e8 00007ffa`99b58d2c UnityPlayer!il2cpp::vm::SocketPollingThreadEntryPoint+0xec [ c:\users\tautvydas\builds\bin2\il2cppoutputproject\il2cpp\libil2cpp\vm\threadpool.cpp @ 524]
00000022`e25ff7f0 00007ffa`9da83610 UnityPlayer!il2cpp::vm::g_SocketPollingThread
00000022`e25ff7f8 00007ffa`99b57700 UnityPlayer!il2cpp::vm::FreeThreadHandle [ c:\users\tautvydas\builds\bin2\il2cppoutputproject\il2cpp\libil2cpp\vm\threadpool.cpp @ 488]
00000022`e25ff800 00000000`0000106c
00000022`e25ff808 cccccccc`cccccccc
00000022`e25ff810 00007ffa`9da83610 UnityPlayer!il2cpp::vm::g_SocketPollingThread
00000022`e25ff818 000001c4`1705f5c0
00000022`e25ff820 cccccccc`0000106c
...............
00000022`e25ff860 00005eaa`e9a6af86
00000022`e25ff868 cccccccc`cccccccc
00000022`e25ff870 00000022`e25ff8d0
00000022`e25ff878 00007ffa`99c63b52 UnityPlayer!il2cpp::os::Thread::RunWrapper+0xd2 [ c:\users\tautvydas\builds\bin2\il2cppoutputproject\il2cpp\libil2cpp\os\thread.cpp @ 106]
00000022`e25ff880 00007ffa`9da83610 UnityPlayer!il2cpp::vm::g_SocketPollingThread
00000022`e25ff888 00000000`00000018
00000022`e25ff890 cccccccc`cccccccc
...............
00000022`e25ff8a8 000001c4`15508c90
00000022`e25ff8b0 cccccccc`00000002
00000022`e25ff8b8 00007ffa`99b58c40 UnityPlayer!il2cpp::vm::SocketPollingThreadEntryPoint [ c:\users\tautvydas\builds\bin2\il2cppoutputproject\il2cpp\libil2cpp\vm\threadpool.cpp @ 494]
00000022`e25ff8c0 00007ffa`9da83610 UnityPlayer!il2cpp::vm::g_SocketPollingThread
00000022`e25ff8c8 000001c4`155a5890
00000022`e25ff8d0 00000022`e25ff920
00000022`e25ff8d8 00007ffa`99c19a14 UnityPlayer!il2cpp::os::ThreadStartWrapper+0x54 [ c:\users\tautvydas\builds\bin2\il2cppoutputproject\il2cpp\libil2cpp\os\win32\threadimpl.cpp @ 31]
00000022`e25ff8e0 000001c4`155a5890
...............
00000022`e25ff900 cccccccc`cccccccc
00000022`e25ff908 00007ffa`99c63a80 UnityPlayer!il2cpp::os::Thread::RunWrapper [ c:\users\tautvydas\builds\bin2\il2cppoutputproject\il2cpp\libil2cpp\os\thread.cpp @ 80]
00000022`e25ff910 000001c4`155a5890
...............
00000022`e25ff940 000001c4`1e0801b0
00000022`e25ff948 00007ffa`e6858102 KERNEL32!BaseThreadInitThunk+0x22
00000022`e25ff950 000001c4`1e0801b0
00000022`e25ff958 00000000`00000000
00000022`e25ff960 00000000`00000000
00000022`e25ff968 00000000`00000000
00000022`e25ff970 00007ffa`99c199c0 UnityPlayer!il2cpp::os::ThreadStartWrapper [ c:\users\tautvydas\builds\bin2\il2cppoutputproject\il2cpp\libil2cpp\os\win32\threadimpl.cpp @ 26]
00000022`e25ff978 00007ffa`e926c5b4 ntdll!RtlUserThreadStart+0x34
00000022`e25ff980 00007ffa`e68580e0 KERNEL32!BaseThreadInitThunk
Here’s a rough reconstructed stacktrace:
00000022`e25fec28 00007ffa`b1fdf54c ucrtbased!_calloc_dbg+0x6c [...\appcrt\heap\debug_heap.cpp @ 511]
00000022`e25fec68 00007ffa`b1fdb69e ucrtbased!calloc+0x2e [...\appcrt\heap\calloc.cpp @ 25]
00000022`e25feca8 00007ffa`99b3b646 UnityPlayer!il2cpp::os::SocketImpl::Poll+0x66 [...\libil2cpp\os\win32\socketimpl.cpp @ 1429]
00000022`e25ff3f8 00007ffa`99c1caf4 UnityPlayer!il2cpp::os::Socket::Poll+0x44 [...\libil2cpp\os\socket.cpp @ 324]
00000022`e25ff428 00007ffa`99b585f8 UnityPlayer!il2cpp::vm::SocketPollingThread::RunLoop+0x268 [...\libil2cpp\vm\threadpool.cpp @ 452]
00000022`e25ff7e8 00007ffa`99b58d2c UnityPlayer!il2cpp::vm::SocketPollingThreadEntryPoint+0xec [...\libil2cpp\vm\threadpool.cpp @ 524]
00000022`e25ff878 00007ffa`99c63b52 UnityPlayer!il2cpp::os::Thread::RunWrapper+0xd2 [...\libil2cpp\os\thread.cpp @ 106]
00000022`e25ff8d8 00007ffa`99c19a14 UnityPlayer!il2cpp::os::ThreadStartWrapper+0x54 [...\libil2cpp\os\win32\threadimpl.cpp @ 31]
00000022`e25ff948 00007ffa`e6858102 KERNEL32!BaseThreadInitThunk+0x22
00000022`e25ff978 00007ffa`e926c5b4 ntdll!RtlUserThreadStart+0x34
Alright, so now I knew which thread was crashing: it was the IL2CPP runtime socket polling thread. Its responsibility is tell other threads when their sockets are ready to send or receive data. It goes like this: there’s a FIFO queue that socket poll requests get put in by other threads, the socket polling thread then dequeues these requests one by one, calls select() function and when select() returns a result, it queues a callback that was in the original request to the thread pool.
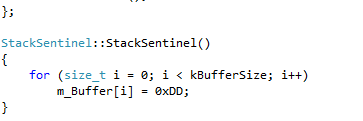
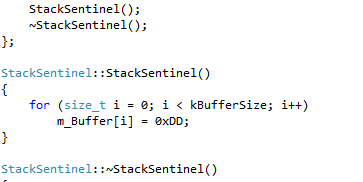
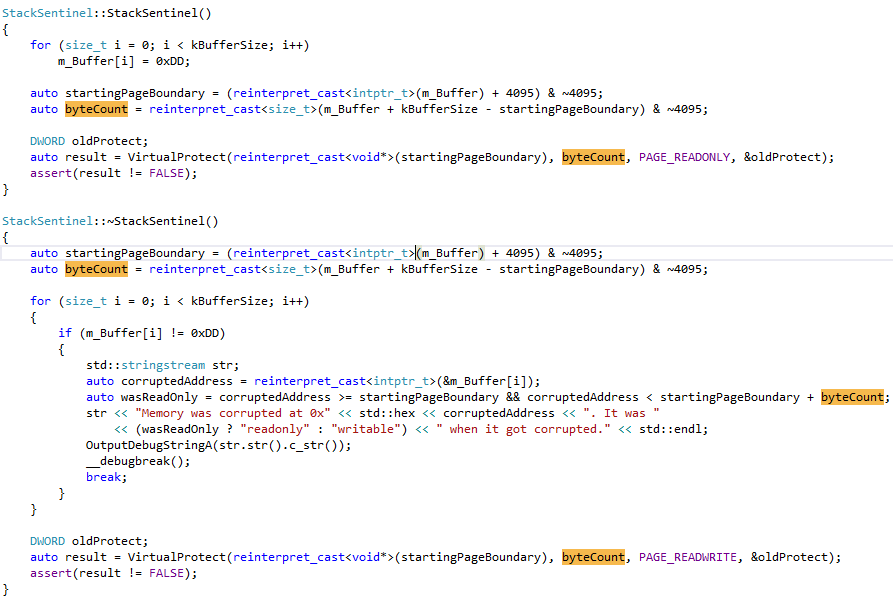
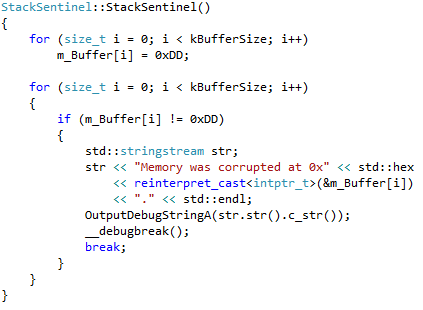
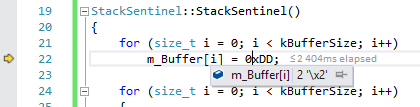
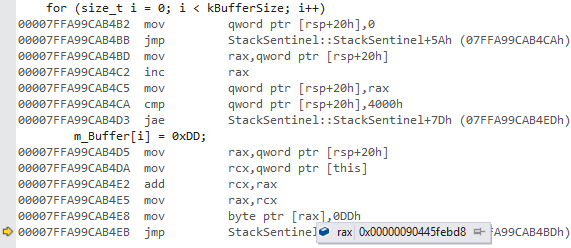
So somebody is corrupting the stack badly. In order to narrow the search, I decided to put “stack sentinels” on most stack frames in that thread. Here’s how my stack sentinel was defined:

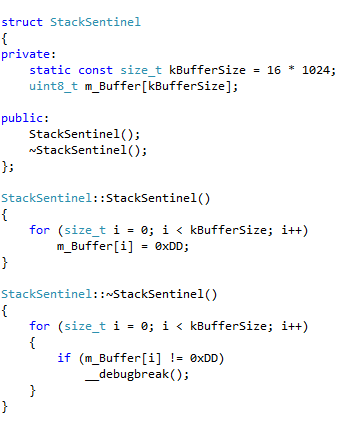
When it’s constructed, it would fill the buffer with “0xDD”. When it’s destructed, it would check if those values did not change. This worked incredibly well: the game was no longer crashing! It was asserting instead:

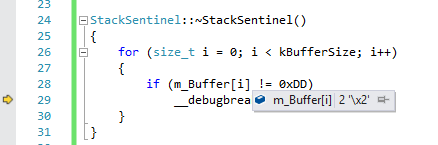
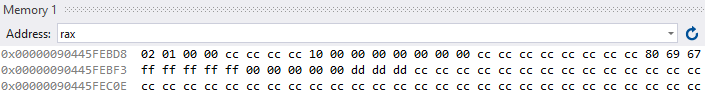
Somebody had been touching my sentinel’s privates - and it definitely wasn’t a friend. I ran this a couple more times, and the result was the same: every time a value of “2” was written to the buffer first. Looking at the memory view, I noticed that what I saw was familiar:

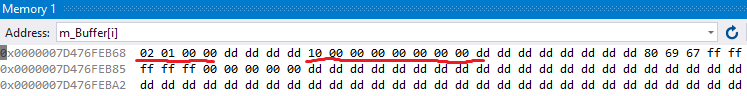
These are the exact same values that we’ve seen in the very first corrupted stack trace. I realized that whatever caused the crash earlier was also responsible for corrupting the stack sentinel. At first, I thought that this was some kind of a buffer overflow, and somebody was writing outside of their local variable bounds. So I started placing these stack sentinels much more aggressively: before almost every function call that the thread made. However, the corruptions seemed to happen at random times, and I wasn’t able to find what was causing them using this method.
I knew that memory was always getting corrupted while one of my sentinels is in scope. I somehow needed to catch the thing that corrupts it red handed. I figured to make the stack sentinel memory read only for the duration of the stack sentinel life: I would call VirtualProtect() in the constructor to mark pages read only, and call it again in the destructor to make them writable:

To my surprise, it was still being corrupted! And the message in the debug log was:
CrashingGame.exe has triggered a breakpoint.
This was a red flag to me. Somebody had been corrupting memory either while the memory was read only, or just before I set it to read only. Since I got no access violations, I assumed that it was the latter so I changed the code to check whether memory contents changed right after setting my magic values:

My theory checked out:
CrashingGame.exe has triggered a breakpoint.
At this point I was thinking: “Well, it must be another thread corrupting my stack. It MUST be. Right? RIGHT?”. The only way I knew how to proceed in investigating this was to use data (memory) breakpoints to catch the offender. Unfortunately, on x86 you can watch only four memory locations at a time, that means I can monitor 32 bytes at most, while the area that had been getting corrupted was 16 KB. I somehow needed to figure out where to set the breakpoints. I started observing corruption patterns. At first, it seemed that they are random, but that was merely an illusion due to the nature of ASLR: every time I restarted the game, it would place the stack at random memory address, so the place of corruption naturally differed. However, when I realized this, I stopped restarting the game every time memory became corrupted and just continued execution. This led me to discover that the corrupted memory address was always constant for a given debugging session. In other words, once it had been corrupted once, it would always get corrupted at the exact same memory address as long as I don’t terminate the program:
CrashingGame.exe has triggered a breakpoint.
Memory was corrupted at 0x90445febd8.
CrashingGame.exe has triggered a breakpoint.
I set a data breakpoint on that memory address and watched as it kept breaking whenever I set it to a magic value of 0xDD. I figured, this was going to take a while, but Visual Studio actually allows me to set a condition on that breakpoint: to only break if the value of that memory address is 2:

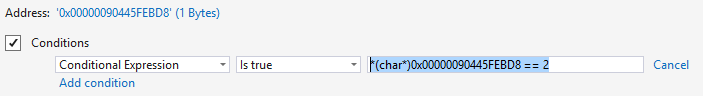
A minute later, this breakpoint finally hit. I arrived at this point in time after 3 days into debugging this thing. This was going to be my triumph. “I finally pinned you down!”, I proclaimed. Or so I so optimistically thought:

I watched at the debugger with disbelief as my mind got filled with more questions than answers: “What? How is this even possible? Am I going crazy?”. I decided to look at the disassembly:

Sure enough, it was modifying that memory location. But it was writing 0xDD to it, not 0x02! After looking at the memory window, the whole region was already corrupted:

As I was ready to bang my head against the wall, I called my coworker and asked him to look whether I had missed something obvious. We reviewed the debugging code together and we couldn’t find anything that could even remotely cause such weirdness. I then took a step back and tried imagining what could possibly be causing the debugger to break thinking that code set the value to “2”. I came up with the following hypothetical chain of events:
1. mov byte ptr [rax], 0DDh modifies the memory location, CPU breaks execution to let debugger inspect the program state
2. Memory gets corrupted by something
3. Debugger inspects the memory address, finds “2” inside and thinks that’s what changed.
So… what can change memory contents while the program is frozen by a debugger? As far as I know, that’s possible in 2 scenarios: it’s either another process doing it, or it’s the OS kernel. To investigate either of these, a conventional debugger will not work. Enter kernel debugging land.
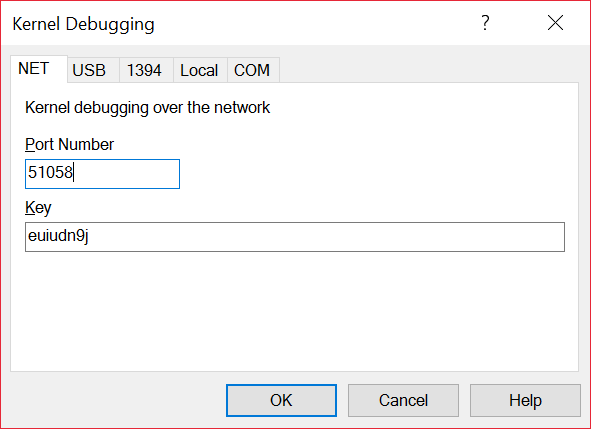
Surprisingly, setting up kernel debugging is extremely easy on Windows. You’ll need 2 machines: the one debugger will run on, and the one you’ll debug. Open up elevated command prompt on the machine which you’re going to be debugging, and type this:


Host IP is the IP address of the machine that has the debugger running. It will use the specified port for the debugger connection. It can be anywhere between 49152 and 65535. After hitting enter on the second command, it will tell you a secret key (truncated in the picture) which acts as a password when you connect the debugger. After completing these steps, reboot.
On the other computer, open up WinDbg, click on File -> Kernel Debug and enter port and key.

If everything goes well, you’ll be able to break execution by pressing Debug -> Break. If that works, the “debugee” computer will freeze. Enter “g” to continue execution.
I started up the game and waited for it to break once so I could find out the address at which memory gets corrupted:
CrashingGame.exe has triggered a breakpoint.
Alright, now that I knew the address where to set a data breakpoint, I had to configure my kernel debugger to actually set it:
PROCESS ffffe00167228080
SessionId: 1 Cid: 26b8 Peb: 49cceca000 ParentCid: 03d8
DirBase: 1ae5e3000 ObjectTable: ffffc00186220d80 HandleCount:
Image: CrashingGame.exe
kd> .process /i ffffe00167228080
You need to continue execution (press 'g'
to be switched. When the debugger breaks in again, you will be in
the new process context.
kd> g
Break instruction exception - code 80000003 (first chance)
nt!DbgBreakPointWithStatus:
fffff801`7534beb0 cc int 3
kd> .process
Implicit process is now ffffe001`66e9e080
kd> .reload /f
kd> ba w 1 0x00000049D05FEDD8 ".if (@@c++(*(char*)0x00000049D05FEDD8 == 2)) { k } .else { gc }"
After some time, the breakpoint actually hit...
00 ffffd000`23c1e980 fffff801`7527dc64 nt!IopCompleteRequest+0xef
01 ffffd000`23c1ea70 fffff801`75349953 nt!KiDeliverApc+0x134
02 ffffd000`23c1eb00 00007ffd`7e08b4bd nt!KiApcInterrupt+0xc3
03 00000049`d05fad50 cccccccc`cccccccc UnityPlayer!StackSentinel::StackSentinel+0x4d [...\libil2cpp\utils\memory.cpp @ 21]
Alright, so what’s going on here?! The sentinel is happily setting its magic values, then there’s a hardware interrupt, which then calls some completion routine, and that writes “2” into my stack. Wow. Okay, for some reason Windows kernel is corrupting my memory. But why?
At first, I thought that this has to be us calling some Windows API and passing it invalid arguments. So I went through all the socket polling thread code again, and found that the only system call that we’ve been calling there was the select() function. I went to MSDN, and spent an hour rereading the docs on select() and rechecking whether we were doing everything correctly. As far as I could tell, there wasn’t really much you could do wrong with it, and there definitely wasn’t a place in docs where it said “if you pass it this parameter, we’ll write 2 into your stack”. It seemed like we were doing everything right.
After running out of things to try, I decided to step into the select() function with a debugger, step through its disassembly and figure out how it works. It took me a few hours, but I managed to do it. It seems that the select() function is a wrapper for the WSPSelect(), which roughly looks like this:
/* setting up some state
…
*/
IO_STATUS_BLOCK statusBlock;
auto result = NtDeviceIoControlFile(networkDeviceHandle, completionEvent, nullptr, nullptr, &statusBlock, 0x12024,
buffer, bufferLength, buffer, bufferLength);
if (result == STATUS_PENDING)
WaitForSingleObjectEx(completionEvent, INFINITE, TRUE);
/* convert result and return it
...
*/
The important part here is the call to NtDeviceIoControlFile(), the fact that it passes its local variable statusBlock as an out parameter, and finally the fact that it waits for the event to be signalled using an alertable wait. So far so good: it calls a kernel function, which returns STATUS_PENDING if it cannot complete the request immediately. In that case, WSPSelect() waits until the event is set. Once NtDeviceIoControlFile() is done, it writes the result to statusBlock variable and then sets the event. The wait completes and then WSPSelect() returns.
IO_STATUS_BLOCK struct looks like this:
{
union
{
NTSTATUS Status;
PVOID Pointer;
};
ULONG_PTR Information;
} IO_STATUS_BLOCK, *PIO_STATUS_BLOCK;
On 64-bit, that struct is 16 bytes long. It caught my attention that this struct seems to match my memory corruption pattern: the first 4 bytes get corrupted (NTSTATUS is 4 bytes long), then 4 bytes get skipped (padding/space for PVOID) and finally 8 more get corrupted. If that was indeed what was being written to my memory, then the first four bytes would contain the result status. The first 4 corruption bytes were always 0x00000102. And that happens to be the error code for… STATUS_TIMEOUT! That would be a sound theory, if only WSPSelect() didn’t wait for NtDeviceIOControlFile() to complete. But it did.
After figuring out how the select() function worked, I decided to look at the big picture on how socket polling thread worked. And then it hit me like a ton of bricks.
When another thread pushes a socket to be processed by the socket polling thread, the socket polling thread calls select() on that function. Since select() is a blocking call, when another socket is pushed to the socket polling thread queue it has to somehow interrupt select() so the new socket gets processed ASAP. How does one interrupt select() function? Apparently, we used QueueUserAPC() to execute asynchronous procedure while select() was blocked… and threw an exception out of it! That unrolled the stack, had us execute some more code, and then at some point in the future the kernel would complete the work and write the result to statusBlock local variable (which no longer existed at that point in time). If it happened to hit a return address on the stack, we’d crash.
The fix was pretty straightforward: instead of using QueueUserAPC(), we now create a loopback socket to which we send a byte any time we need to interrupt select(). This path has been used on POSIX platforms for quite a while, and is now used on Windows too. The fix for this bug shipped in Unity 5.3.4p1.
This is one of those bugs that keep you up at night. It took me 5 days to solve, and it’s probably one of the hardest bugs I ever had to look into and fix. Lesson learnt, folks: do not throw exceptions out of asynchronous procedures if you’re inside a system call!
Is this article helpful for you?
Thank you for your feedback!
- Unity Labs
- Copyright © 2024 Unity Technologies