Analyzing your application’s physical memory footprint using Memory Profiler


When it comes to efficiently detecting memory issues and optimizing performance, the information shown on the Memory Profiler, as well as the information’s precision, is key. We’re investing significant effort in this area. In two recent blogs, members of my team introduced Memory Profiler 1.0.0 and shared five key workflows to diagnose and examine memory-related issues in your game.
Soon, we will be releasing Memory Profiler 1.1 (an experimental version is available now), which includes updated labels and descriptions to explain how memory works and how application memory footprint is calculated.
Since memory footprint continues to be a hot topic in our conversations with developers, I’m here to answer your frequently asked questions – specifically, to cover these three topics:
- What resident memory is
- How application memory footprint is calculated
- How to analyze memory footprint
Resident memory, defined
Let’s drill into memory allocation in Unity. When the engine allocates memory, it first reserves multiple memory pages in the virtual address space that can fit the requested allocation. Pages are the smallest units of memory management. Virtual address space and physical storage are each organized into pages, and the page size depends on the platform used. For example, on x86 computers a page size is 4 KB.
After the engine has reserved enough pages, it asks the operating system (OS) to “commit” physical storage to memory. This is why allocated memory is often referred to as “committed.” Next, the OS registers that the pages now have physical storage assigned and they can be accessed. Your application-reported “total committed memory” will then increase. However, the physical memory footprint of your application stays the same.

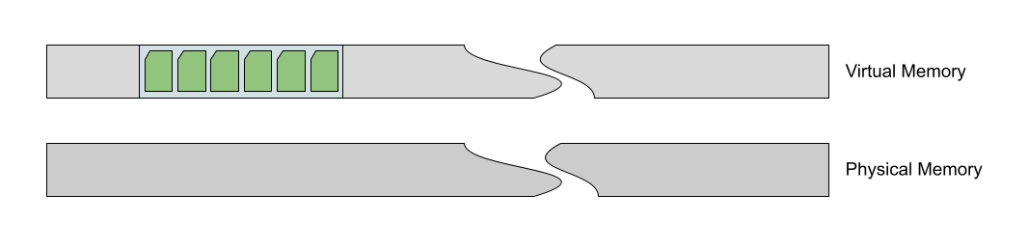
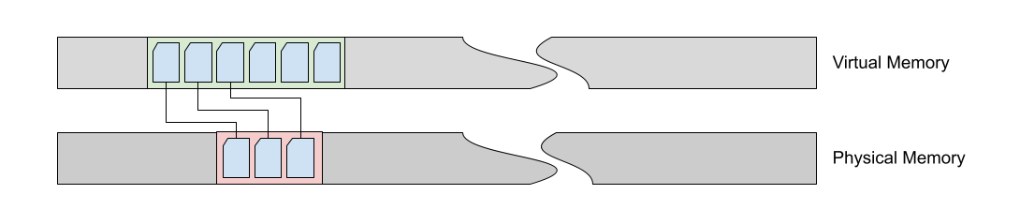
The footprint stays the same because, even though you’ve committed your region to physical storage, most OSs are lazy and thrifty, so there’s no assignment of a specific physical storage location. As an example, let’s say you decide to write something in the committed region. There is not yet any physical memory underneath the region, so accessing it will incur a page fault. In response, the OS’s memory manager will allocate a previously available physical page in order to complete your operation. Because all operations are performed with page-size granularity, unaccessed pages of the region will remain empty and without physical memory assigned. Similarly, your application’s resident memory size will increase by the total size of all physical memory pages allocated to complete your operation.

If a page has not been accessed for a while or demand for physical memory is high, an OS might offload some pages from your allocated region either to compressed memory or a page swap file, depending on what is supported on your platform.

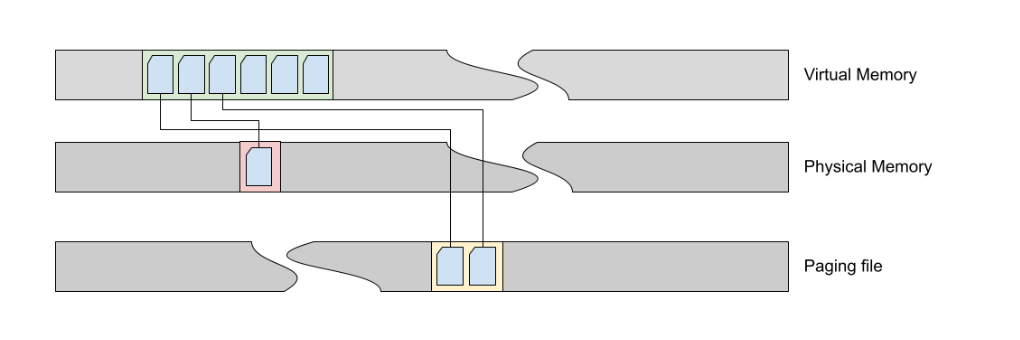
In this case, your application’s reported allocated memory will stay the same but resident memory size will decrease.
How application memory footprint is calculated
As you might have already realized, if you only look at allocated memory you may be misled by which allocation consumes your physical memory, which can trick you into optimizing something that isn’t a problem. Not only does this waste your valuable time, you don’t see any difference in your application performance and stability.
Overall, your application memory state can be described by this diagram:

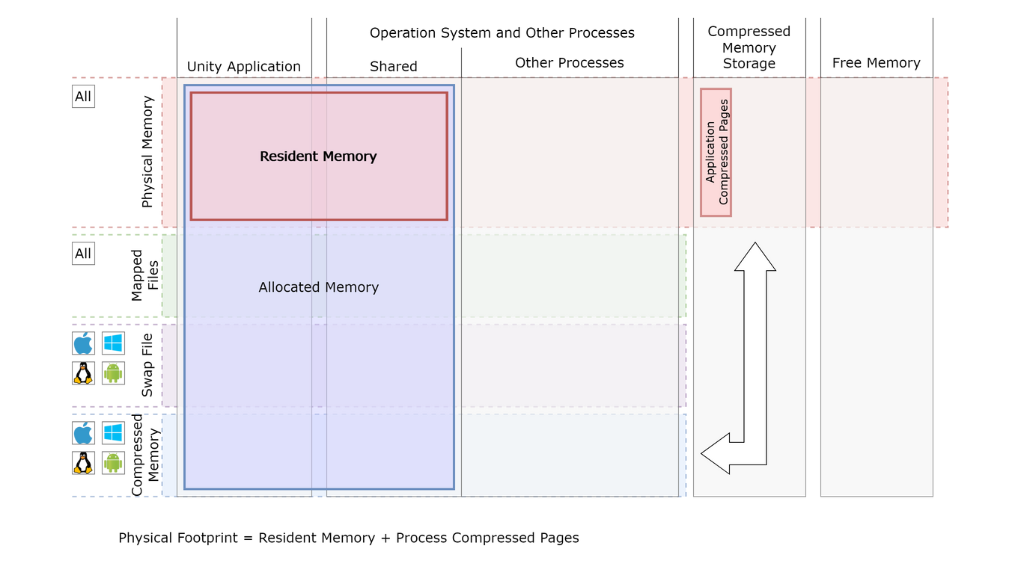
In summary, here’s how the memory footprint is calculated:
Physical memory footprint = Application resident memory + Application compressed memory pages
Analyze the memory footprint
In Memory Profiler 1.1, the Summary, Unity Objects, and All Of Memory views will not only show Allocated memory size but also provide information about Resident memory. However, this information will only be shown if the Memory Profiler snapshot is made with Unity 2022.2 or newer. With older snapshots, you’ll still see updated UI and breakdown views, but without information on Resident memory.

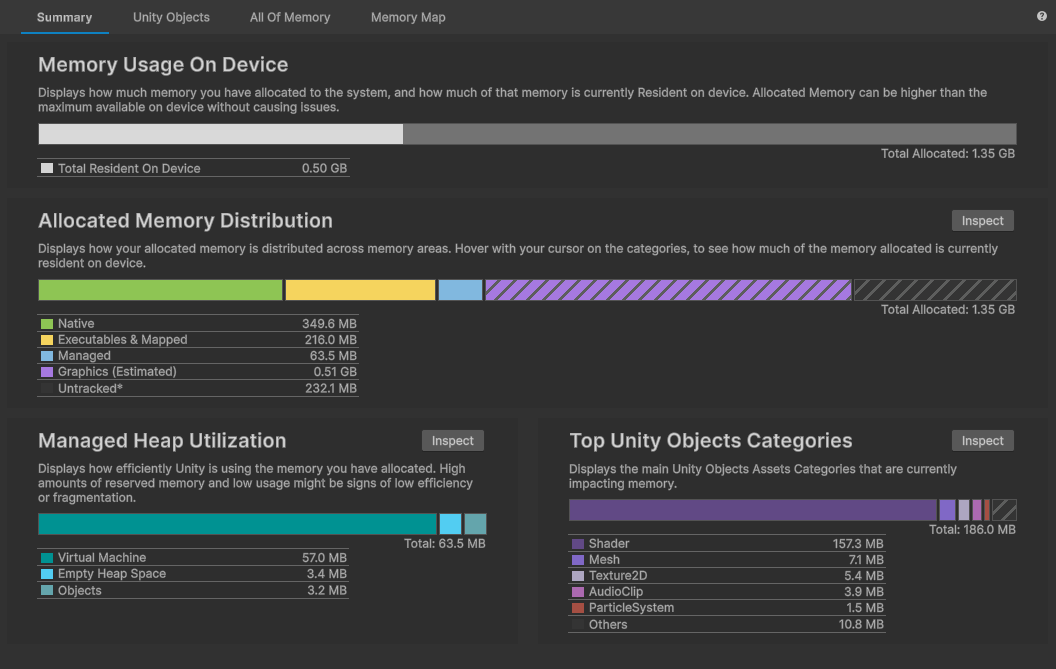
The Summary view provides a general overview and an essential metric: Total Resident on Device. If your application needs to run on a platform with limited memory, Total Resident on Device is critical for reviewing low memory warnings and out-of-memory evictions. As a rule of thumb, you shouldn’t go over 70% of the total physical memory available on a device.
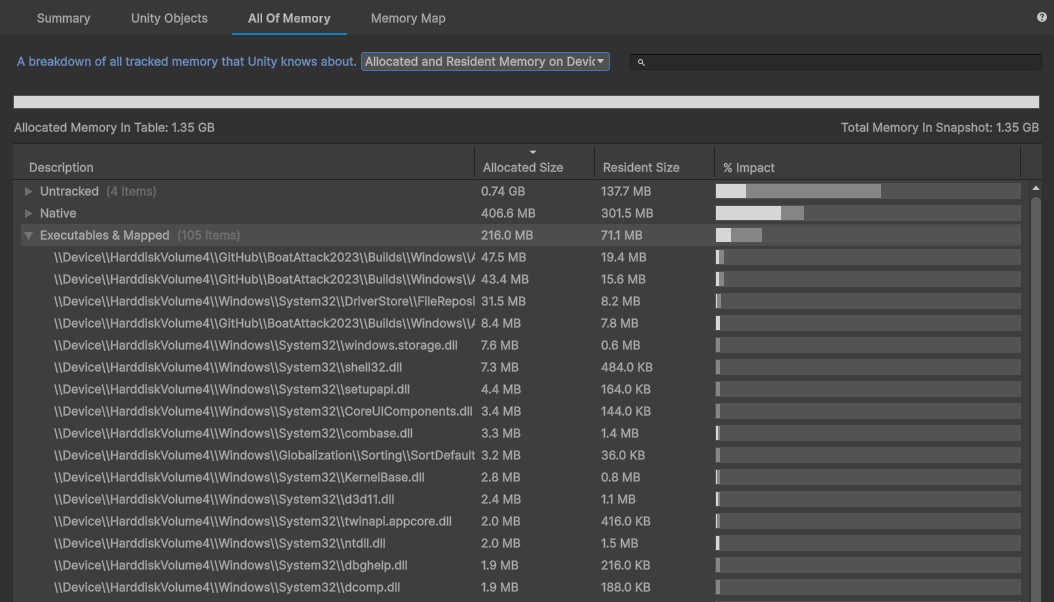
For detailed analysis, you can use Unity Objects and All of Memory views. You’ll need to select Resident on Device or Allocated and Resident on Device from the dropdown menu and sort by Resident size to see objects that contribute most to the total physical memory used.

When analyzing resident memory usage, remember:
- Managed memory will be dominantly resident. Mono Heap and Boehm Garbage Collector regularly access objects and make them resident.
- Graphics memory (estimated) is shown as estimated. On most platforms, we don’t have access to information on the exact whereabouts of the graphics resources, so we estimate size based on available information like width, height, depth, pixel format, and so on. This also means we don’t have information about graphics resources’ residency status. For usability reasons, all graphics objects are shown only in the Allocated view mode.
- Untracked is all memory reported by the OS as allocated by the application, but which lacks solid information on the source of the allocation. It could be native plugins, OS libraries, thread stacks, etc. On some platforms, we provide additional insights into who might have allocated that memory in the group breakdown.
When analyzing Native memory, which contains all Unity non-managed allocations used by objects, you’ll see the Reserved memory item. This is memory allocated by Unity Memory Manager but not used by any Unity object during capture. Here’s some helpful information:
- Reserved memory can be resident, which means that there might have been an object that was recently deleted.
- You can access additional information about Reserved breakdown by going to the Memory Profiler settings and enabling the “Show reserved memory breakdown” checkbox. By default, this is disabled, as Reserved breakdown doesn’t always contain enough actionable information and requires a deep understanding of how Unity Memory Manager works.
- You can learn more about Unity Memory Manager and allocation strategies in the allocators setup documentation.
On some platforms, we show additional platform-specific groups if they’re of significant size, like Android Runtime on Android. Here are some notes on Android Runtime:
- On some versions, Android Runtime tends to preallocate a significant amount of memory but never use it. In that case, allocated memory doesn’t add to the application memory footprint and only the resident part of it needs to be considered.
- If the Android Runtime resident part is taking up a significant amount of the application memory footprint, use the Android Studio profiler to analyze allocations done in Java.
- Although Android doesn’t have a page file or memory compression by default, the Linux kernel allows applications to overcommit and allocate more memory than is physically available.
- When capturing, make sure you understand the device you’re using. Some vendors supply the Android Linux kernel with memory compression (zRAM) or vendor-custom page swap file tools.
Conclusion
We hope this overview of what to expect in Memory Profiler 1.1 (experimental version available now) and exploration of various topics around memory footprint have been helpful.
My team and I plan to continue improving the Memory Profiler to provide more precise and targeted information, as well as warn you about potential out-of-memory situations and how close they might be. Follow the progress on our product roadmap and tell us what you think.
Share your feedback with us in the forums. Be sure to watch for new technical blogs from other Unity developers as part of the ongoing Tech from the Trenches series.
Is this article helpful for you?
Thank you for your feedback!
- Unity Labs
- Copyright © 2024 Unity Technologies