Detecting performance bottlenecks with Unity Frame Timing Manager


Creating a standout experience that runs smoothly on a variety of devices and platforms can be challenging. That’s why we continue to refine our tools, such as our improved Frame Timing Manager, for optimization across the board. Read on to discover how the Unity 2022.1 update provides enhanced platform support for this feature, enabling you to collect more data than previously possible.
What can the Frame Timing Manager do for you?
What can the Frame Timing Manager do for you?
The Frame Timing Manager is a feature that provides frame-level time measurements like total frame CPU and GPU times. Compared to the general-purpose Unity Profiler and Profiler API, the Frame Timing Manager is designed for a very specific task, and therefore comes with a much lower performance overhead. The amount of information collected is carefully limited as it highlights only the most important frame stats.
One main reason for leveraging the Frame Timing Manager is to investigate performance bottlenecks in deeper detail. This allows you to determine what curbs your application performance: Is it bound by the main thread or render thread on CPU, or is it GPU-bound? Based on your analysis, you can take further action to improve performance.
The dynamic resolution feature supports fixing detected bottlenecks on the GPU side. You can then increase or reduce rendering resolution to dynamically control the amount of work on the GPU.
During development, you can even visualize timing in an application HUD, which allows you to have a real-time, high-level mini Profiler built right in your application. This way, it’s always readily available to use.
Lastly, you can use the Frame Timing Manager for release mode performance reporting. Based on collected information, you can send statistics to your servers regarding your application’s performance on different platforms for better overall decision-making.
Which measurements does the Frame Timing Manager API provide?
Which measurements does the Frame Timing Manager API provide?
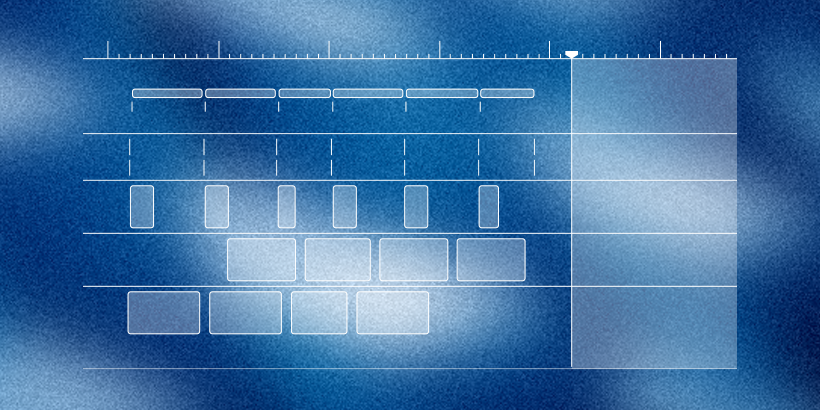
The Frame Timing Manager API provides a set of useful CPU and GPU measurements per frame as the FrameTiming struct. Here’s a list of them:
- cpuFrameTime refers to the total CPU frame time. It is calculated as the time between the start of the frame and the next frame on the main thread.
- cpuMainThreadFrameTime is the main thread’s work time, or the total amount of time between the start of the frame and the main thread finishing its job.
- cpuRenderThreadFrameTime refers to the render thread’s work time, or the total amount of time between the first work request submitted to the render thread and the time when the Present() function is called.
- cpuMainThreadPresentWaitTime is the duration the CPU spends waiting for Present() to complete during the frame.
- gpuFrameTime is the GPU’s work time, or the total amount of time between the work submitted to the GPU and the signal indicating that the GPU has finished the job. See relevant limitations in the “Supported platforms and limitations” section below.

Note that the cpuMainThreadPresentWaitTime is the sum of shown “[wait]” blocks, and includes waits for Present() and target fps. It’s harder to show GPU work time, as it starts somewhere in the middle of “Scene rendering” and finishes on the next frame’s sync point with the previous frame.
How to get started
How to get started
First, it’s worth noting that the Frame Timing Manager is always active in development builds. If you plan to use it only in development, you don’t need to complete any additional steps – you can just use the Frame Timing Manager C# API or its counters.
For release builds, you need to explicitly activate the feature before you can use it. There are multiple ways to do this. One straightforward approach is to tick a checkbox in Project Player settings. In this case, you can read data using the C# API. Unfortunately, however, it is the least efficient method. If you enable the feature in settings, it’ll remain active whether or not you need it at a specific point in time.

using Unity.Profiling;
using UnityEngine;

public class ExampleScript : MonoBehaviour
{
    FrameTiming[] m_FrameTimings = new FrameTiming[10];

    void Update()
    {
        // Instruct FrameTimingManager to collect and cache information
        FrameTimingManager.CaptureFrameTimings();


        // Read cached information about N last frames (10 in this example)
        // The returned value tells how many samples is actually returned
        var ret = FrameTimingManager.GetLatestTimings((uint)m_FrameTimings.Length, m_FrameTimings);
        if (ret > 0)
        {
            // Your code logic here
        }
    }
}
Alternatively, you can read Frame Timing Manager values using the Profiler Recorder API. The benefit of the Profiler Recorder API is that the Frame Timing Manager measurements are only taken when you attach a recorder to the counter, giving you dynamic control over the feature and its overhead.
using Unity.Profiling;
using UnityEngine;

public class ExampleScript : MonoBehaviour
{
    ProfilerRecorder mainThreadTimeRecorder;

    void OnEnable()
    {
        // Create ProfilerRecorder and attach it to a counter
        mainThreadTimeRecorder = ProfilerRecorder.StartNew(ProfilerCategory.Internal, "CPU Main Thread Frame Time");
    }

    void OnDisable()
    {
        // Recorders must be explicitly disposed after use
        mainThreadTimeRecorder.Dispose();
    }

    void Update()
    {
        var frameTime = mainThreadTimeRecorder.LastValue;
        // Your code logic here
    }
}
Bottleneck detection
Bottleneck detection
Data provided by the Frame Timing Manager can be used for bottleneck detection. In the most simple variant, you can compare the main thread CPU, render thread CPU, Present Wait, and GPU time to determine which one is the largest and most probable cause of frame rate limitation. For example:
using Unity.Profiling;
using UnityEngine;

public class ExampleScript : MonoBehaviour
{
    internal enum PerformanceBottleneck
    {
        Indeterminate,      // Cannot be determined
        PresentLimited,     // Limited by presentation (vsync or framerate cap)
        CPU,                // Limited by CPU (main and/or render thread)
        GPU,                // Limited by GPU
        Balanced,           // Limited by both CPU and GPU, i.e. well balanced
    }

    FrameTiming[] m_FrameTimings = new FrameTiming[1];

    void Update()
    {
        FrameTimingManager.CaptureFrameTimings();
        var ret = FrameTimingManager.GetLatestTimings((uint)m_FrameTimings.Length, m_FrameTimings);
        if (ret > 0)
        {
            var bottleneck = DetermineBottleneck(m_FrameTimings[0]);
            // Your code logic here
        }
    }

    static PerformanceBottleneck DetermineBottleneck(FrameTimeSample s)
    {
        const float kNearFullFrameTimeThresholdPercent = 0.2f;
        const float kNonZeroPresentWaitTimeMs = 0.5f;

        // If we're on platform which doesn't support GPU time
        if (s.GPUFrameTime == 0)
            return PerformanceBottleneck.Indeterminate;

        float fullFrameTimeWithMargin = (1f - kNearFullFrameTimeThresholdPercent) * s.FullFrameTime;

        // GPU time is close to frame time, CPU times are not
        if (s.GPUFrameTime > fullFrameTimeWithMargin &&
            s.MainThreadCPUFrameTime < fullFrameTimeWithMargin &&
            s.RenderThreadCPUFrameTime < fullFrameTimeWithMargin)
            return PerformanceBottleneck.GPU;

        // One of the CPU times is close to frame time, GPU is not
        if (s.GPUFrameTime < fullFrameTimeWithMargin &&
            (s.MainThreadCPUFrameTime > fullFrameTimeWithMargin ||
             s.RenderThreadCPUFrameTime > fullFrameTimeWithMargin))
            return PerformanceBottleneck.CPU;

        // Main thread waited due to Vsync or target frame rate
        if (s.MainThreadCPUPresentWaitTime > kNonZeroPresentWaitTimeMs)
        {
            // None of the times are close to frame time
            if (s.GPUFrameTime < fullFrameTimeWithMargin &&
                s.MainThreadCPUFrameTime < fullFrameTimeWithMargin &&
                s.RenderThreadCPUFrameTime < fullFrameTimeWithMargin)
                return PerformanceBottleneck.PresentLimited;
        }

        return PerformanceBottleneck.Balanced;
    }
}
HUD
HUD
The Frame Timing Manager can be used as a simple onscreen Profiler, useful for assessing application health. Its most basic form might look like this:
using System;
using UnityEngine;
using Unity.Profiling;

public class FrameTimingsHUDDisplay : MonoBehaviour
{
    GUIStyle m_Style;
    readonly FrameTiming[] m_FrameTimings = new FrameTiming[1];

    void Awake()
    {
        m_Style = new GUIStyle();
        m_Style.fontSize = 15;
        m_Style.normal.textColor = Color.white;
    }

    void OnGUI()
    {
        CaptureTimings();

        var reportMsg =
            $"\nCPU: {m_FrameTimings[0].cpuFrameTime :00.00}" +
            $"\nMain Thread: {m_FrameTimings[0].cpuMainThreadFrameTime:00.00}" +
            $"\nRender Thread: {m_FrameTimings[0].cpuRenderThreadFrameTime:00.00}" +
            $"\nGPU: {m_FrameTimings[0].gpuFrameTime:00.00}";

        var oldColor = GUI.color;
        GUI.color = new Color(1, 1, 1, 1);
        float w = 300, h = 210;

        GUILayout.BeginArea(new Rect(32, 50, w, h), "Frame Stats", GUI.skin.window);
        GUILayout.Label(reportMsg, m_Style);
        GUILayout.EndArea();

        GUI.color = oldColor;
    }

    private void CaptureTimings()
    {
        FrameTimingManager.CaptureFrameTimings();
        FrameTimingManager.GetLatestTimings(m_FrameTimings.Length, m_FrameTimings);
    }
}
Supported platforms and limitations
Supported platforms and limitations
The Frame Timing Manager supports all platforms that are supported by Unity with the following exceptions:
- On Linux platforms when the OpenGL API is used, no GPU time is provided.
- On the WebGL platform, no GPU time is provided.
- On iOS and macOS when the Metal API is used, it’s been reported that GPU time could potentially be higher than the total frame time under heavy GPU load.
The important implementation specifics of the Frame Timing Manager are:
- Frame Timing Manager produces results with a fixed delay of four frames. This means that you get results for a frame that is four frames behind (not for the current frame). The Frame Timing Manager provides time measurements synchronized for the same frame for both CPU and GPU. Due to platform and hardware limitations, GPU timing results aren’t immediately available on most platforms.
- Frame Timing Manager doesn’t guarantee that the GPU will be available for all of the frames. The GPU might fail to return results on time, or return any results at all. In these cases, the GPU Frame Time is reported as zero.
- On platforms that don’t allow GPU timestamping, Unity computes the Frame Complete Time value rather than measuring it. More specifically, Unity computes Frame Complete Time as First Submit Timestamp + GPU time. If the GPU fails to provide GPU time, Frame Complete Time is automatically set as equal to Present Timestamp.
- On GPUs that use tile-based deferred rendering architecture, like mobile platforms, results are less precise because GPU execution is deferred, and the execution of rendering phases might be done separately. The Frame Timing Manager can only measure overall duration.
Advanced topics
Advanced topics
For advanced users, the Frame Timing Manager provides timestamp information that can be used for frame timeline visualization or calculating deltas with other markers.
The timestamps provided are:
- frameStartTimestamp: The CPU clock time when the frame first starts
- firstSubmitTimestamp: The CPU clock time when the initial work is submitted to the GPU during the frame (platform and API dependent); different platforms submit at different times.
- cpuTimePresentCalled: The CPU clock time at the point Present() is called for the frame. It’s the time when Unity finishes submitting objects for rendering and informs the GPU that the frame can be presented to the user.
- cpuTimeFrameComplete: The CPU clock time at the point when the GPU finishes rendering the frame. On most platforms, this value is calculated and equals First Submit Timestamp + Frame GPU time.

Let us know what you think
Let us know what you think
We hope that these improvements will help you measure and understand your application’s unique performance story. These benefits are now in your hands with Unity 2022.1.
If you’re wondering what’s next for our profiling tools, check out our roadmap here. Otherwise, please feel free to reach out to the team on our forum. We would love to hear your thoughts and see how we can further improve Unity’s performance features and tooling.
Is this article helpful for you?
Thank you for your feedback!
- Unity Labs
- Copyright © 2024 Unity Technologies